EMDataResource Pseudotorsion Plot Beta Server
RNA adopts complex three-dimensional folding patterns and has key roles in many cellular functions. Many cryoEM-derived structures contain RNA, including ribosomal particles, spliceosomes, RNA viruses, and polymerase complexes, yet procedures for validation of RNA structures are not as well developed as those for proteins.
This prototype web-service for virtual torsion angle validation of RNA structures can be applied to structures determined using cryo-EM as well as other structural methods. Virtual torsion angle plots for nucleic acids are analogous to Ramachandran plots for proteins. The tool evaluates single structures, either by file upload (mmCIF or PDB format) or by entering a PDB id.
The research community has developed simplified ways to represent nucleic acid backbone conformation through use of virtual torsion angles1-3. A common scheme is to define two virtual torsion angles (pseudotorsions), eta (η) and theta (θ) for a nucleotide triplet. The measured (η,θ) pair defines the backbone conformation relative to central residue (i).
The server calculates three varieties of pseudotorsion angles, as shown in the image below. In all definitions, phosphate atom positions are used, but the alternate atom differs: it is either the C4' atom (η,θ), C1' atom (η',θ'), or base origin4,5 position (η",θ").
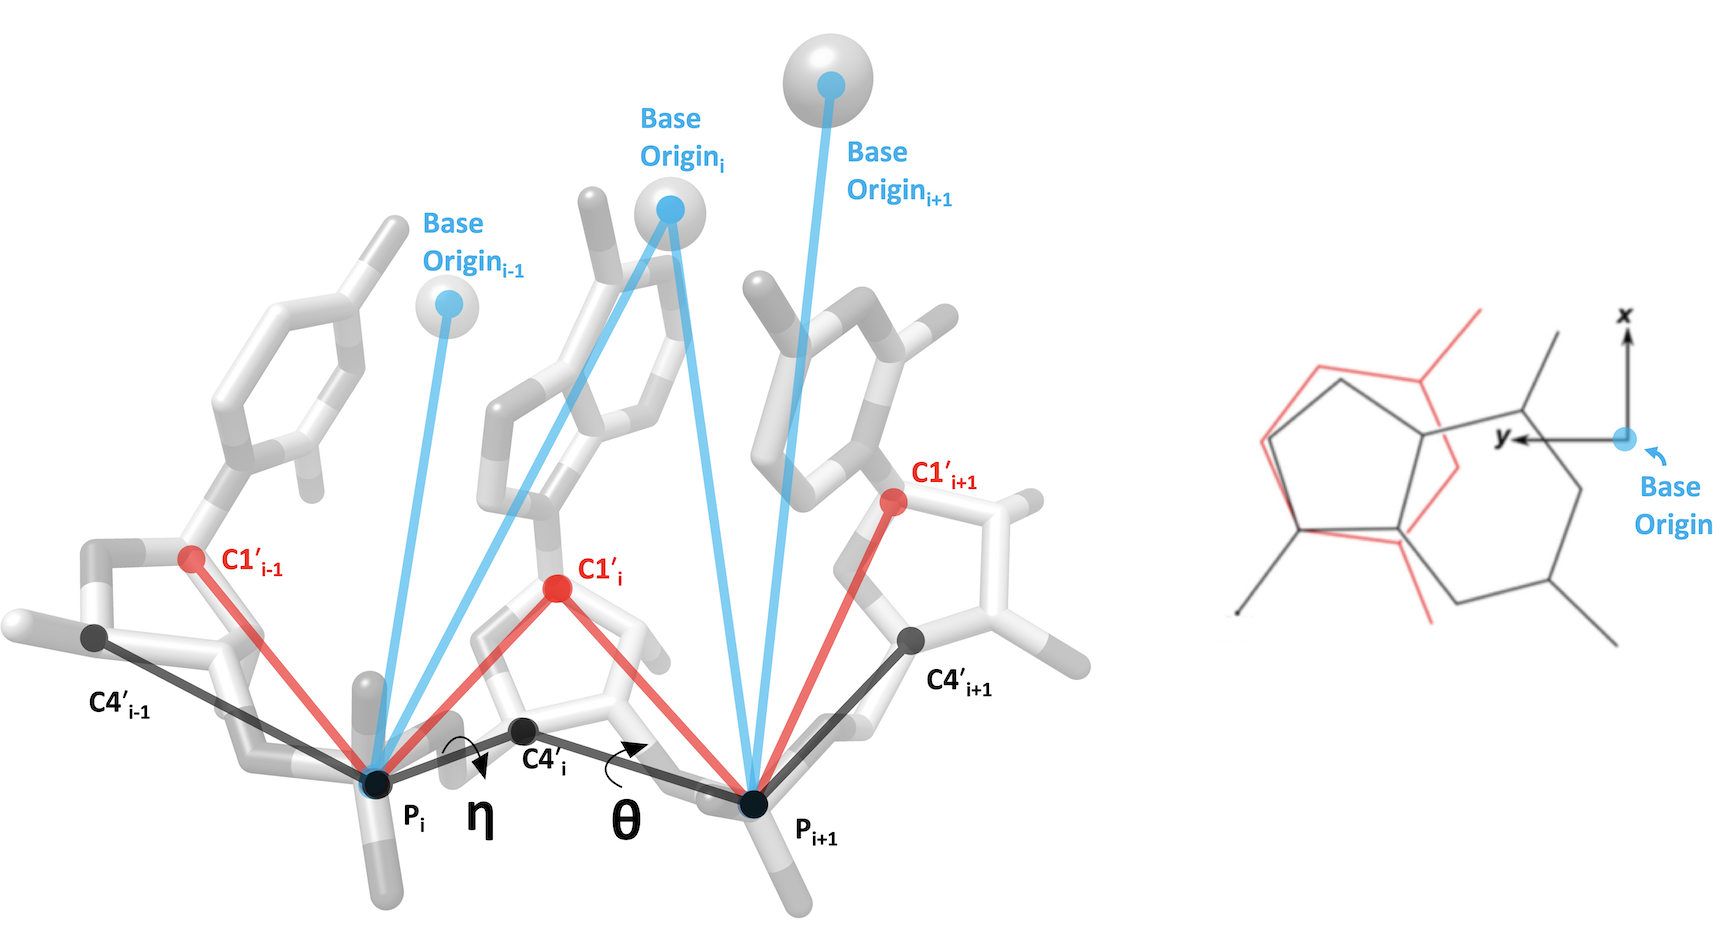
Virtual torsion angles of the RNA backbone (calculated using DSSR4) are compared against the statistical distribution of a benchmark set of high quality, non-redundant6 RNA structures determined by X-ray crystallography at ≤ 2.5 Å. Separate analyses are performed based on sugar-puckering type (of ~27,000 residues in the benchmark set, ~24,000 are C3'-endo-like, ~3,000 are C2'-endo-like). Output plots and and a downloadable (csv format) table identify probable conformational outliers for any given RNA-containing structure. For comparison, RNA Suiteness7,8 scores are also provided in the csv (for residue i, suiteness of the i-1, i dinucleotide is listed. Suiteness range is 0(poor)-1(excellent). Calculation performed using DSSR).
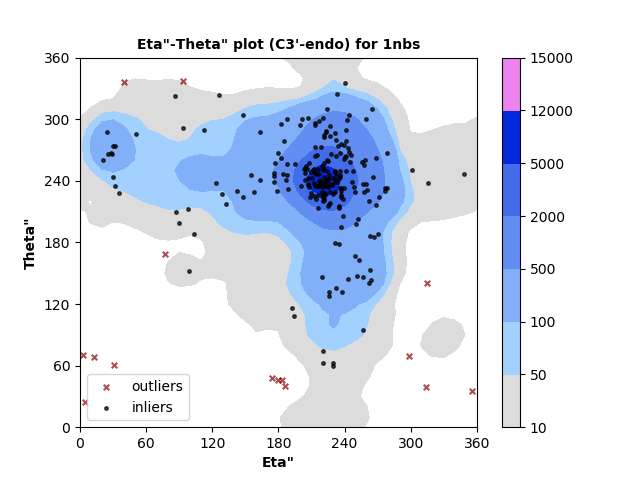
The 2D plots permit comparison of pseudotorsion pairs for the structure being evaluated (plotted points) against population statistics of the benchmark set (smoothed contours: bar at right indicates benchmark residue count range). Outliers are marked on the plots by red crosses with residue information available on mouse hover. Summary statistics are provided below each plot to indicate the number of residues evaluated and percent outliers. Note that pseudotorsion angles cannot be calculated for terminal residues or around breaks in the polymer chain, so these are excluded from evaluation.
This tool is designed to identify regions of unusual conformation in folded RNA. Outliers can be legitimate but less-common backbone conformations, or they may indicate modelling error.
It may take several minutes to complete calculations for large structures such as ribosomes.
Please direct any questions/suggestions to help@emdataresource.org
- Olson, W. K. Configurational statistics of polynucleotide chains. An updated virtual bond model to treat effects of base stacking. Macromolecules 13, 721-728 (1980).
- Wadley, L. M., Keating, K. S., Duarte, C. M. & Pyle, A. M. Evaluating and learning from RNA pseudotorsional space: quantitative validation of a reduced representation for RNA structure. J Mol Biol 372, 942-957, doi (2007).
- Keating, K. S., Humphris, E. L. & Pyle, A. M. A new way to see RNA. Q Rev Biophys 44, 433-466, doi (2011).
- Lu, X. J., Bussemaker, H. J. & Olson, W. K. DSSR: an integrated software tool for dissecting the spatial structure of RNA. Nucleic Acids Res 43, e142, doi (2015).
- Li, S., Olson, W. K., Lu, X. J. Web 3DNA 2.0 for the analysis, visualization, and modeling of 3D nucleic acid structures. Nucleic Acids Research 47, W26-W34 (2019). doi
- Leontis, N. B., & Zirbel, C. L. Nonredundant 3D Structure Datasets for RNA Knowledge Extraction and Benchmarking. In RNA 3D Structure Analysis and Prediction, N. Leontis & E. Westhof (Eds.), (Vol. 27, pp. 281-298). Springer Berlin Heidelberg. doi (2012).
- Richardson, J. S., Schneider, B., Murray, L. W., Kapral, G. J., Immormino, R.M., Headd, J. J., Richardson, D. C., Ham, D., Hershkovits, E., Williams, L. D., Keating, K. S., Pyle, A. M., Micallef, D., Westbrook, J., Berman, H. M. RNA backbone: consensus all-angle conformers and modular string nomenclature (an RNA Ontology Consortium contribution). RNA 14, 465-81, doi (2008).
- Chen, V. B., Arendall III, W. B., Headd, J. J., Keedy, D. A., Immormino, R. M., Kapral, G. J., Murray, L. W., Richardson, J. S., Richardson, D. C., MolProbity: all-atom structure validation for macromolecular crystallography, Acta Cryst D 66, 12-21, doi (2010)
RNA Pseudotorsion Plots for PDB entry 1nbs
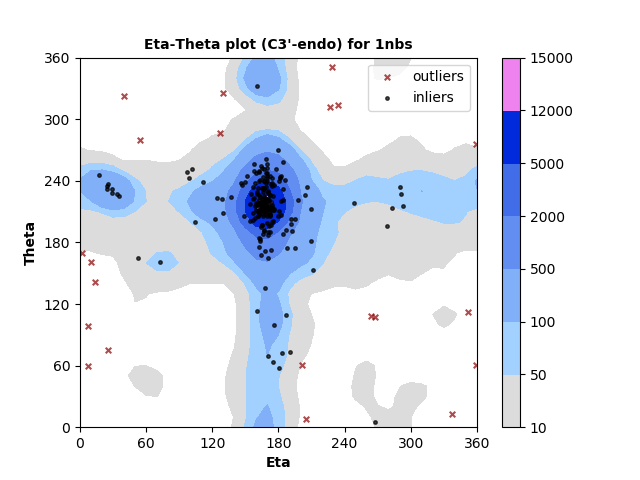
248 C3'-endo RNA residues with 21 outliers ( 8.47 % ) from Eta-Theta plot
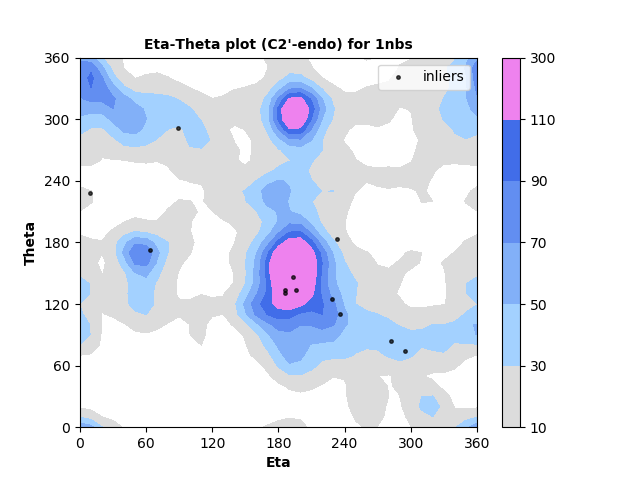
12 C2'-endo RNA residues with 0 outliers ( 0.0 % ) from Eta-Theta plot
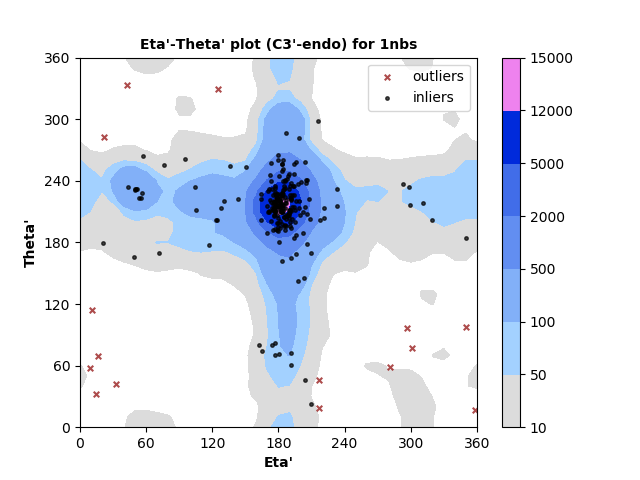
248 C3'-endo RNA residues with 15 outliers ( 6.05 % ) from Eta'-Theta' plot
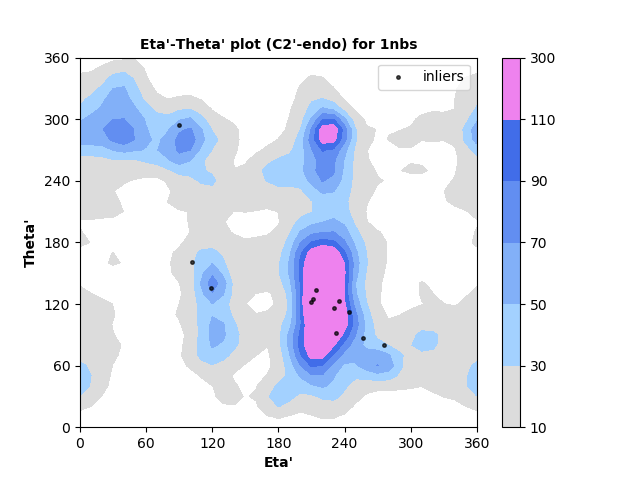
12 C2'-endo RNA residues with 0 outliers ( 0.0 % ) from Eta'-Theta' plot
248 C3'-endo RNA residues with 15 outliers ( 6.05 % ) from Eta"-Theta" plot
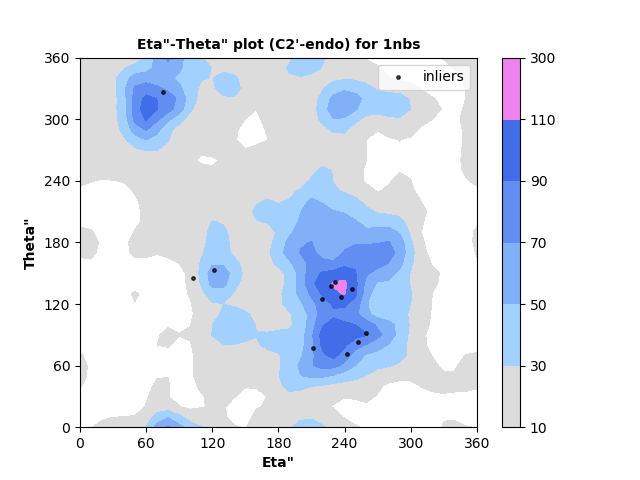
12 C2'-endo RNA residues with 0 outliers ( 0.0 % ) from Eta"-Theta" plot
List of Outliers
| Model Number | Chain | Residue Type | Residue Identifier | Eta | Theta | Eta' | Theta' | Eta'' | Theta'' | Sugar Pucker | Suiteness |
|---|---|---|---|---|---|---|---|---|---|---|---|
| 1 | A | A | 98 | 226.9 | 312.3 | --- | --- | --- | --- | C3'endo | 0.404 |
| 1 | A | A | 99 | 268.1 | 107.1 | 301.3 | 77.0 | 314.1 | 39.5 | C3'endo | 0.0 |
| 1 | A | G | 100 | 13.2 | 141.4 | 11.0 | 114.2 | 31.0 | 60.3 | C3'endo | 0.059 |
| 1 | A | U | 101 | 54.6 | 280.0 | --- | --- | --- | --- | C3'endo | 0.0 |
| 1 | A | A | 130 | 25.0 | 74.8 | 32.2 | 42.3 | 4.3 | 24.3 | C3'endo | 0.317 |
| 1 | A | C | 134 | 228.4 | 350.8 | 217.2 | 18.4 | --- | --- | C3'endo | 0.032 |
| 1 | A | A | 194 | 337.7 | 12.6 | 358.8 | 16.7 | 2.6 | 69.9 | C3'endo | 0.0 |
| 1 | A | G | 224 | 127.4 | 287.0 | --- | --- | --- | --- | C3'endo | 0.0 |
| 1 | A | C | 225 | 358.9 | 276.2 | 21.5 | 282.7 | --- | --- | C3'endo | 0.0 |
| 1 | A | A | 229 | 201.4 | 61.1 | 216.5 | 46.1 | --- | --- | C3'endo | 0.0 |
| 1 | A | A | 230 | 7.4 | 59.5 | 9.2 | 57.5 | --- | --- | C3'endo | 0.0 |
| 1 | A | A | 231 | 1.8 | 169.7 | --- | --- | --- | --- | C3'endo | 0.0 |
| 1 | B | A | 98 | 234.5 | 314.0 | --- | --- | --- | --- | C3'endo | 0.01 |
| 1 | B | A | 99 | 263.6 | 108.3 | 296.3 | 96.5 | 298.6 | 69.0 | C3'endo | 0.0 |
| 1 | B | G | 100 | 352.0 | 111.9 | 350.0 | 97.4 | 12.8 | 68.2 | C3'endo | 0.225 |
| 1 | B | A | 130 | 7.5 | 98.7 | 16.5 | 69.1 | 355.5 | 34.8 | C3'endo | 0.093 |
| 1 | B | C | 134 | 204.8 | 7.6 | --- | --- | --- | --- | C3'endo | 0.072 |
| 1 | B | A | 194 | 39.9 | 322.9 | 42.3 | 332.9 | 39.9 | 336.3 | C3'endo | 0.0 |
| 1 | B | G | 224 | 129.7 | 325.2 | 125.0 | 329.4 | --- | --- | C3'endo | 0.0 |
| 1 | B | A | 230 | 359.5 | 60.9 | 14.5 | 32.0 | 93.2 | 337.3 | C3'endo | 0.0 |
| 1 | B | A | 231 | 9.7 | 161.4 | --- | --- | --- | --- | C3'endo | 0.0 |
| 1 | B | C | 225 | --- | --- | 281.4 | 59.1 | 314.4 | 140.6 | C3'endo | 0.0 |
| 1 | A | C | 192 | --- | --- | --- | --- | 186.0 | 40.1 | C3'endo | 0.032 |
| 1 | A | C | 223 | --- | --- | --- | --- | 179.7 | 46.1 | C3'endo | 0.055 |
| 1 | B | C | 131 | --- | --- | --- | --- | 77.0 | 168.8 | C3'endo | 0.04 |
| 1 | B | C | 192 | --- | --- | --- | --- | 183.0 | 46.4 | C3'endo | 0.0 |
| 1 | B | C | 223 | --- | --- | --- | --- | 174.6 | 47.9 | C3'endo | 0.271 |